Newsletter
The money supply is at a record. The Fed's balance sheet isn't driving it.
Not financial advice
This is the first issue of The Satoshi Oath. I write about Bitcoin through a macro lens: monetary policy, inflation, liquidity, real rates, sovereign debt, ETF flows, and market structure. Every Monday I'll send one short issue with the week ahead and one idea worth your time, backed by a chart. Every number is sourced and dated. I make no price calls and will show you the risks as plainly as the case. Thanks for being here at the start.
Upkeep: the week of Oct 19–23
This is a quiet week for scheduled US data, which makes it the calm before a busy one.
- Thu, Oct 22, 4:30 PM ET: Fed balance sheet (H.4.1). The weekly snapshot of the Fed's total assets. The latest reading is $6.76 trillion.
- That's the only major scheduled release on my calendar this week. No CPI, no jobs report, no Fed decision.
Next week is where the action is:
- Tue, Oct 27, 1:00 PM ET: Money stock (H.6), September M2.
- Wed, Oct 28, 2:00 PM ET: FOMC decision, press conference at 2:30 PM. The current target range is 3.75–4.00%.
- Thu, Oct 29, 8:30 AM ET: Q3 GDP (advance) and September PCE inflation (BEA).
- Fri, Oct 30, 8:30 AM ET: Employment Cost Index, Q3 (BLS).
I'll post the FOMC decision and the market reaction on X the same afternoon.
The idea: the money supply is at a record, but the Fed's balance sheet isn't driving it
Here's the chart I keep coming back to: US M2, the Fed's balance sheet, and Bitcoin since 2016.
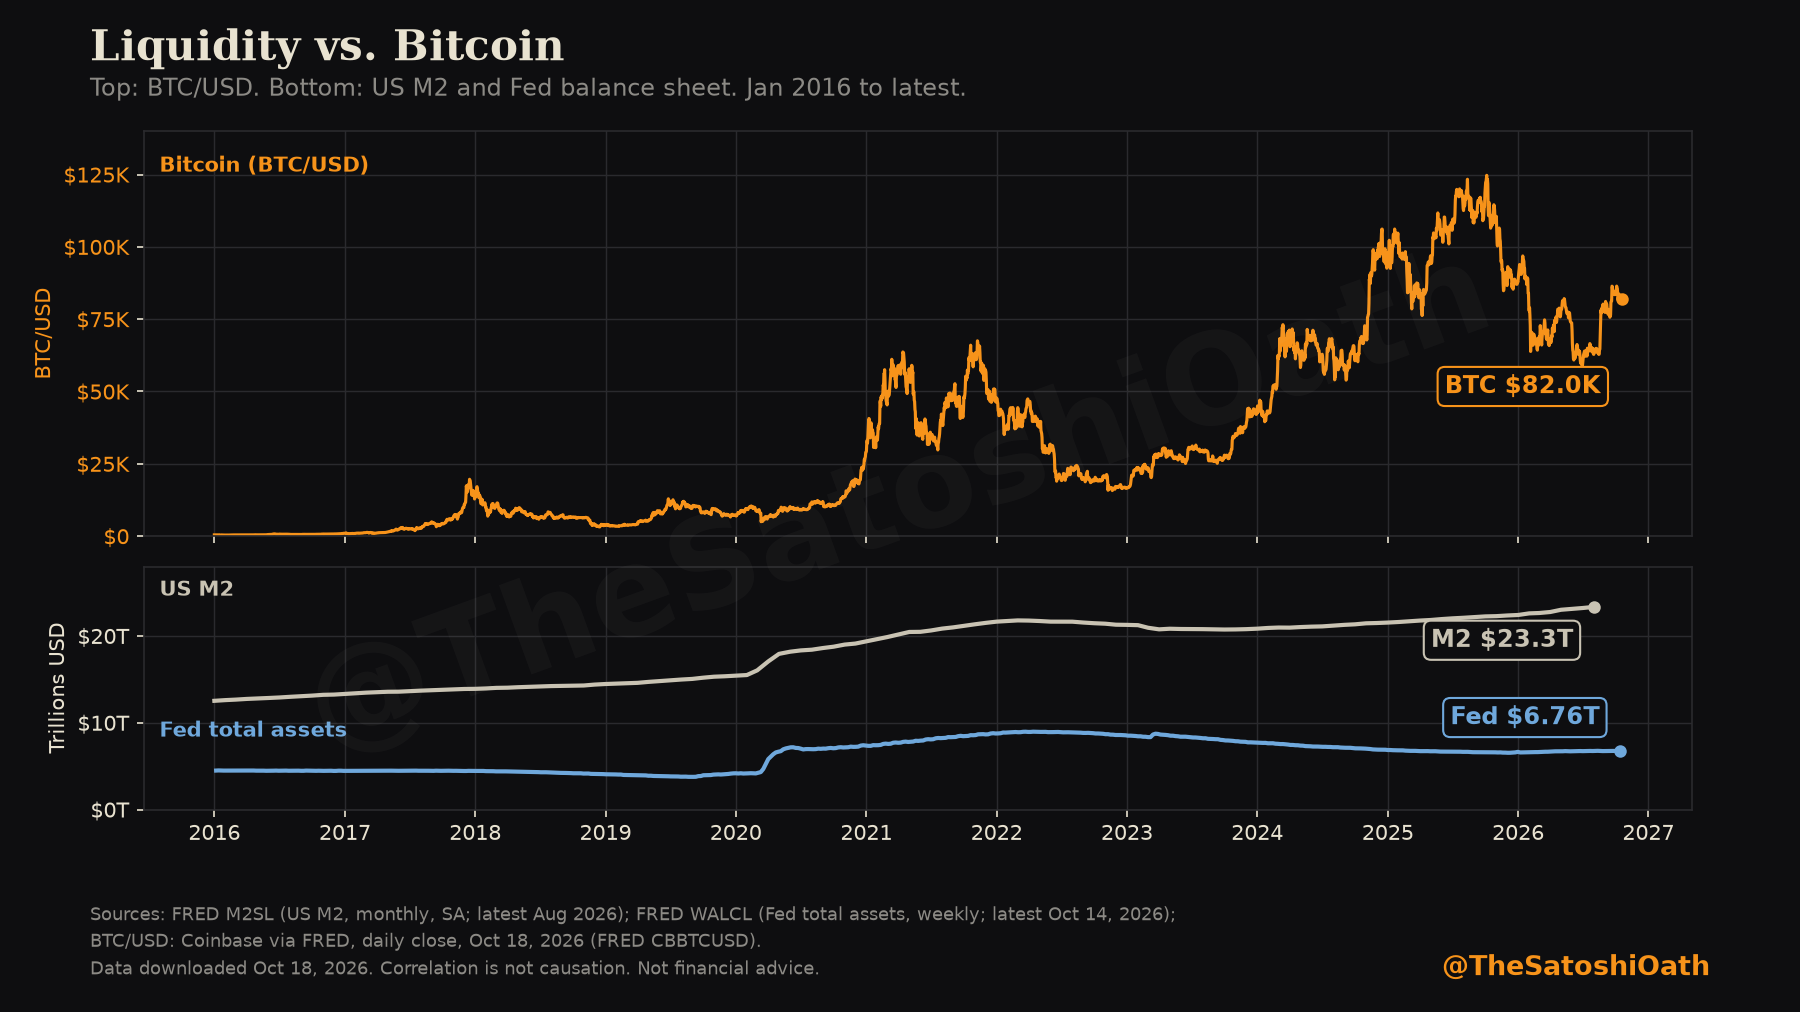
Three things stand out.
1. M2 is at an all-time high. US M2 was $23.34 trillion in August 2026, up 5.7% from a year earlier. It peaked at $21.79 trillion in March 2022, shrank into late 2023, and is now about 7% above that old peak. Broad money is growing again.
2. The Fed's balance sheet isn't driving it. Fed total assets are $6.76 trillion, up only 2.4% year over year and still about 25% below the April 2022 peak of $8.97 trillion. In 2020–21, money growth and the Fed's balance sheet rose together. This time, money is growing while the Fed's balance sheet is roughly flat. That matters: growth that isn't coming from an expanding Fed balance sheet can reverse in different ways, and it doesn't come with a Fed "put."
3. Bitcoin hasn't followed, yet. BTC was $81,978 on Oct 18, about 34% below its October 2025 peak of $124,720. So if liquidity is rising, why isn't Bitcoin?
One explanation consistent with the data: the price of money. The 10-year real yield (TIPS) is 2.78%, up from 1.76% a year ago. Before this year, the last time it was this high was November 2008. When 10-year Treasuries pay nearly 2.8% above inflation, a zero-yield asset faces real competition, even with money growing in the background.
So the setup heading into the Oct 28 FOMC is a tug-of-war: quantity of money up, price of money high. Right now they point opposite ways. I'm watching for the moment real yields roll over. That, more than any single headline, is what I think would let the liquidity tailwind show up in the price.
The Bitcoin check. Does Bitcoin's own behavior confirm that read? Only partly. BTC is 7.0% above its 50-week moving average of $76,589, but that average is still falling. And US spot Bitcoin ETFs saw net outflows of $228 million over Oct 12–16. Liquidity is rising; ETF demand isn't confirming it yet. My verdict for now: mixed.
Could I be wrong? Yes. Liquidity is one driver, not the only one. Lags vary, and correlations break. I'll keep showing you the data either way.
What I'm watching this week
- Whether the 10-year real yield stays near its highest level since 2008.
- Thursday's H.4.1: is the Fed's balance sheet still flat, or starting to move?
- How the market prices Oct 28. I'll share a sourced read on the morning of the decision.
We keep the oath.
— The Satoshi Oath Follow on X: @TheSatoshiOath
Sources (all accessed Oct 18, 2026)
- US M2: FRED M2SL, $23,342.8B, Aug 2026; Aug 2025 $22,092.6B (YoY +5.7%, my calc); Mar 2022 $21,788.1B (my calc: +7.1% vs. latest). https://fred.stlouisfed.org/series/M2SL
- Fed total assets: FRED WALCL, $6,755,639M, week of Oct 14, 2026; Oct 15, 2025 $6,596,454M (YoY +2.4%, my calc); peak $8,965,487M on Apr 13, 2022 (−24.6%, my calc). https://fred.stlouisfed.org/series/WALCL
- BTC/USD: FRED CBBTCUSD (Coinbase via FRED, daily close), $81,977.73 on Oct 18, 2026; high $124,720.09 on Oct 5, 2025, still the series high (−34.3%, my calc). https://fred.stlouisfed.org/series/CBBTCUSD
- 50-week moving average: my calculation from FRED CBBTCUSD (Coinbase), the simple average of the 50 completed Sunday-ending weekly closes through the week ending Oct 18, 2026 = $76,589.36; BTC $81,977.73 on Oct 18 is 7.0% above it; 10 weeks earlier the average was $83,424.20.
- US spot Bitcoin ETF net flows: Farside Investors (US$m), Oct 12 −65.4, Oct 13 +175.7, Oct 14 −261.4, Oct 15 +5.1, Oct 16 −82.4; sum −228.4 (my calc, complete days only). https://farside.co.uk/bitcoin-etf-flow-all-data/
- 10Y real yield: FRED DFII10, 2.78% on Oct 15, 2026; 1.76% on Oct 15, 2025; before 2026, last ≥2.78% on Nov 25, 2008. https://fred.stlouisfed.org/series/DFII10
- Fed funds target range: FRED DFEDTARL/DFEDTARU, 3.75–4.00% as of Oct 18, 2026. https://fred.stlouisfed.org/series/DFEDTARU
- Release dates: Fed H.4.1 https://www.federalreserve.gov/releases/h41/ · Fed H.6 https://www.federalreserve.gov/releases/h6/ · FOMC https://www.federalreserve.gov/monetarypolicy/fomccalendars.htm · BEA https://www.bea.gov/news/schedule · BLS https://www.bls.gov/schedule/2026/home.htm
Educational macro commentary. Not financial advice. Nothing here is a recommendation to buy or sell any asset. Past performance and historical relationships don't guarantee future results.